GeotchaA geography quiz on a real globe
25 countries in the world with the highest CO2 emissions per person
25 countries, each one drawn on a satellite globe. Name it when it lights up, find it when you are given its name, tell its flag from three others, or type every one you can remember in Name all.
Free to start: a few quizzes a day cost nothing, and Geotcha Plus opens every quiz. What you miss comes back for review until it sticks.
The full list
About this quiz
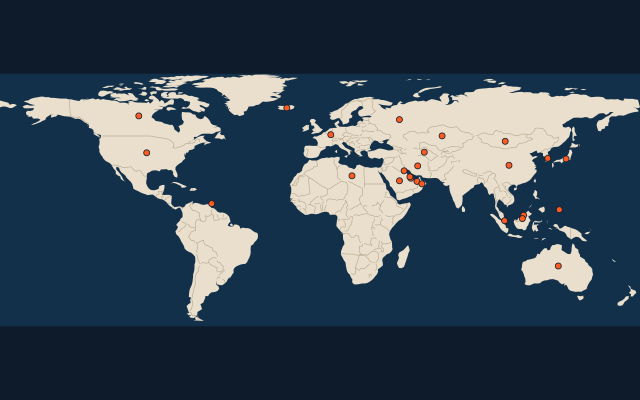
The quiz covers 25 countries, from Qatar and Kuwait to Japan.
What they are known for
- Qatar: The highest CO2 emissions per person in the world
- Kuwait: Its 1990 invasion by a neighbour triggered the Gulf War, and oil fires followed.
- Brunei: A tiny oil-rich sultanate with a gold-domed mosque, on an island it shares with two bigger states.
- Bahrain: Pearl divers made it rich before oil, and a causeway now links it to its giant neighbour.
- Trinidad and Tobago: Birthplace of calypso, soca and the steelpan.
- Saudi Arabia: Holds Mecca and Medina, Islam's holiest cities, and has no permanent river.
- United Arab Emirates: Seven sheikhdoms federated, among them Dubai with the Burj Khalifa.
- Oman: Land of frankincense, with a detached northern tip overlooking the Strait of Hormuz.
The countries
- 1Qatar41.3 t
- 2Kuwait26.3 t
- 3Brunei26.1 t
- 4Bahrain24.3 t
- 5Trinidad and Tobago22.9 t
- 6Saudi Arabia20.4 t
- 7United Arab Emirates20.1 t
- 8Oman15.7 t
- 9Australia14.5 t
- 10United States14.2 t
- 11Kazakhstan13.9 t
- 12Canada13.4 t
- 13Mongolia12.9 t
- 14Palau12.8 t
- 15Russia12.3 t
- 16South Korea11.3 t
- 17Turkmenistan10.8 t
- 18Luxembourg10.5 t
- 19Iceland9.67 t
- 20Singapore9.24 t
- 21Libya8.84 t
- 22China8.66 t
- 23Iran8.66 t
- 24Malaysia8.16 t
- 25Japan7.77 t
On the map
More of the world
- 25 largest cities in the world
- 25 largest countries in the world
- 50 largest regions in the world
- 25 largest lakes in the world
- 25 longest rivers in the world
- 25 highest peaks in the world
- 25 largest islands in the world
- 25 longest fjords in the world
- Flags of the world
- 50 largest cities in the world
The whole world
How the figures are measured
CO2 emissions per person in tonnes a year, from fossil fuels and industry (land use left out), where they are emitted, not where the goods are used (Global Carbon Project, via Our World in Data, 2024). Each item names its year; a country without a recent figure is left out.